Performance of a webapplication can have a huge impact on how users experience your website. The tuning of performance is therefore a very interesting terrain. In this blog a short introduction on performance tuning using Jmeter for load simulation, monitoring the resources [CPU and JVM] with and using TDA for analyzing the threaddump. Assumption is that Linux is used as hosting platform.
Goal is to find out how your resources are used and what needs to be done to get a better performance.
General tips for (frontend) developers
First some basic rules & tips rules for developers:
- check the following website with performance tips
- minimize redundant logging. Since string actions are expensive, make sure DEBUG log is escaped by a check on logger.isdebugenabled()
- XML usage / parsing is expensive. Keep usage of XML reduced to a minimum
Simulating load
The following tools can be used for generating load on a webapplication.
- JMeter, a testing tool by Apache. You can record the steps which need performed in the test with Badboy. This is the preferred tool, which will also be used for the blog.
- ContiPerf; leverages on Junit4 testcases. Based on annotations the required load can be set as well as the required results. In combination with JWebUnit a functional regression test can be ‘upgraded’ to a performancetest.
- The following Java code can be used for executing a piece of code parallel for a number of threads instead of running it sequential.
public class IntegratieTest {
    // start the method testAsync X times concurrently
    // after having started, we give them 1 minute to finish
    public void testAsync(){
       for(int i=0;i<10;i++){
          new Thread() {
             @Override
             public void run(){
                new IntegratieTest().testMethod();
             }
          }.start();
       }

    try {
       Thread.sleep(60000);
    } catch (InterruptedException e) {
       e.printStackTrace();
    }
}

public void testMethod() {
   System.out.println("test start"+ Thread.currentThread().getId());
   try {
      Thread.sleep(15000);
   } catch (InterruptedException e) {
      e.printStackTrace();
   }

   System.out.println("test done"+ Thread.currentThread().getId());
}
Monitor the resources
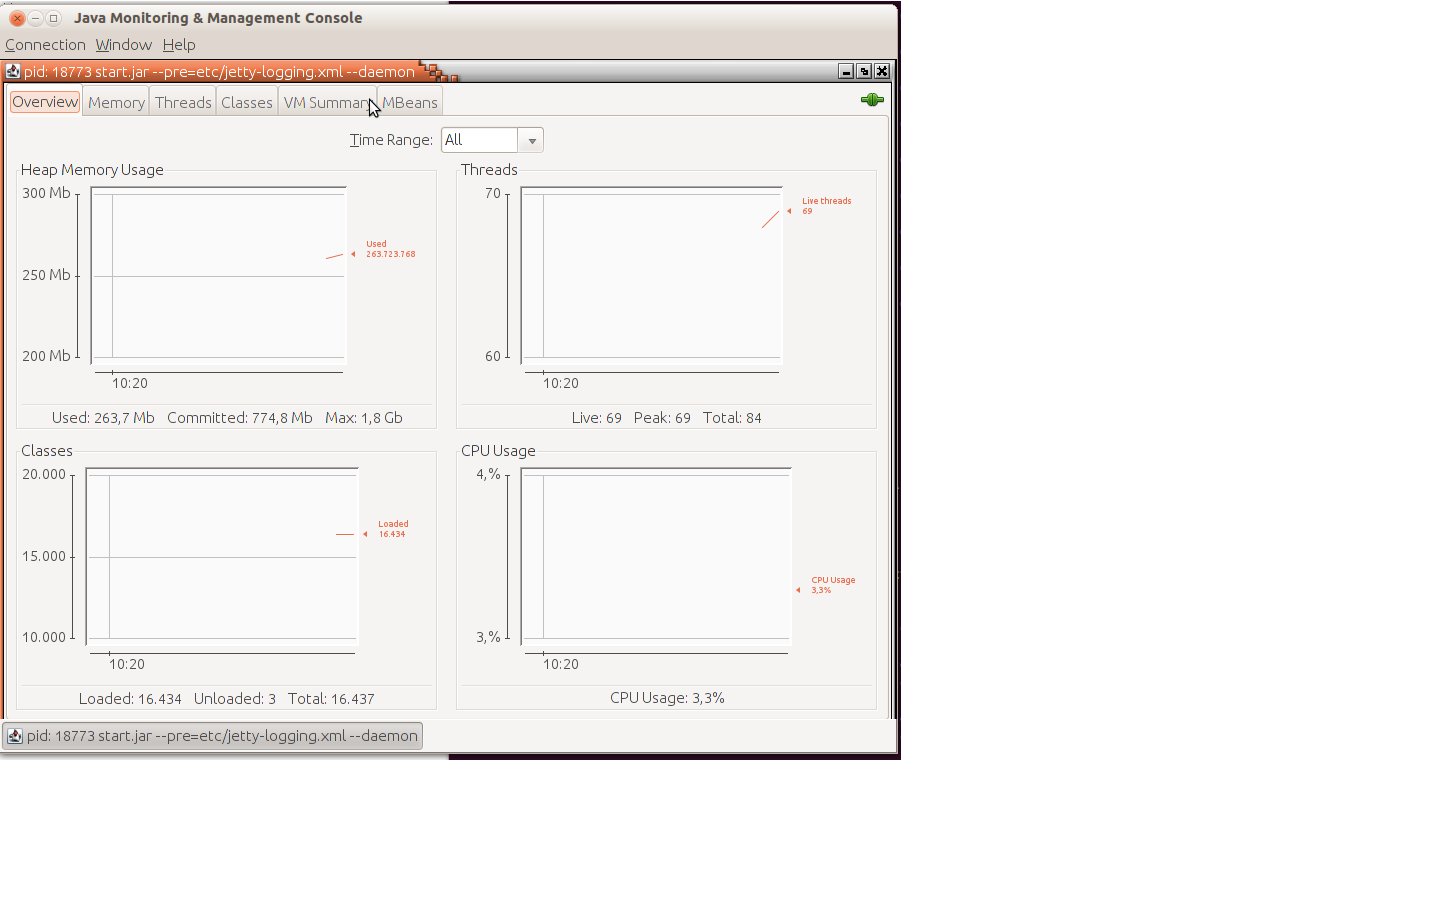
Now that the load is on your webapplication, the resources of the hosting machine must be visualized. For the JVM a tool called jconsole can be used, which from Java 6 is part of the distribution and can be found in the location <jdk>\bin\jconsole
To use jconsole, go to the bin location of a JDK 6+and enter the following command:
jconsole <pid>
The pid can be determined with the following command. Note that this command needs to be run with the user with is owner of the application server!
netstat -tulpn

Note in case you have a JDK prior to version 6:
JDK 5 includes a number of tools that are useful for monitoring the JVM.
Documentation for these tools is available from the <a title="Sun website" href="http://java.sun.com/j2se/1.5.0/docs/tooldocs/index.html#manage" target="_blank">Sun website</a>.
For JDK's prior to 5, Sun provides the [http://developer.sun.com/dev/coolstuff/jvmstat/ jvmstat tools].
Analyse the results
To put a turbo on the engine of the JVM additional memory can reserved by increasing the heapsize. When the CPU capacity is not completely used increasing the number of JVM processes can be tried. Note that the application must be able to handle this.
When you have a Oracle 10g environment the analyses of the JVM can be done by using the dmstool, for example:
dmstool $(dmstool -list | grep Memory | grep EINTAKE)

/<hostname>/opmn:8833:6004/<hostname>:6201/pm/pportal5.psreprt005.ba.nl
 /OC4J/<container name>/default_island/process_1081214892/sharedMemory.value        28468
 /<hostname>/opmn:8833:6004/be03uap196cwir8:6201/pm/pportal5.psreprt005.ba.nl
 /OC4J/<container name>/default_island/process_1081214892/privateMemory.value        1611240
 /<hostname>/opmn:8833:6004/be03uap196cwir8:6201/pm/pportal5.psreprt005.ba.nl
 /OC4J/<container name>/default_island/process_1081214891/sharedMemory.value        28472
 /<hostname>/opmn:8833:6004/be03uap196cwir8:6201/pm/pportal5.psreprt005.ba.nl
 /OC4J/<container name>/default_island/process_1081214891/privateMemory.value        1596244
or:
dmstool $(dmstool -list | grep 12509| grep freeMemory)

/<hostname>/OC4J:12509:6004/JVM/freeMemory.maxValue        1550528.0        kbytes
 /<hostname>/OC4J:12509:6004/JVM/freeMemory.minValue        169035.0        kbytes
 /<hostname>/OC4J:12509:6004/JVM/freeMemory.value        470531        kbytes
So currently 470M free of the allocated heap. The heapsize is reported by the application server. In this example is is 1.6GB per container.
Thread dump
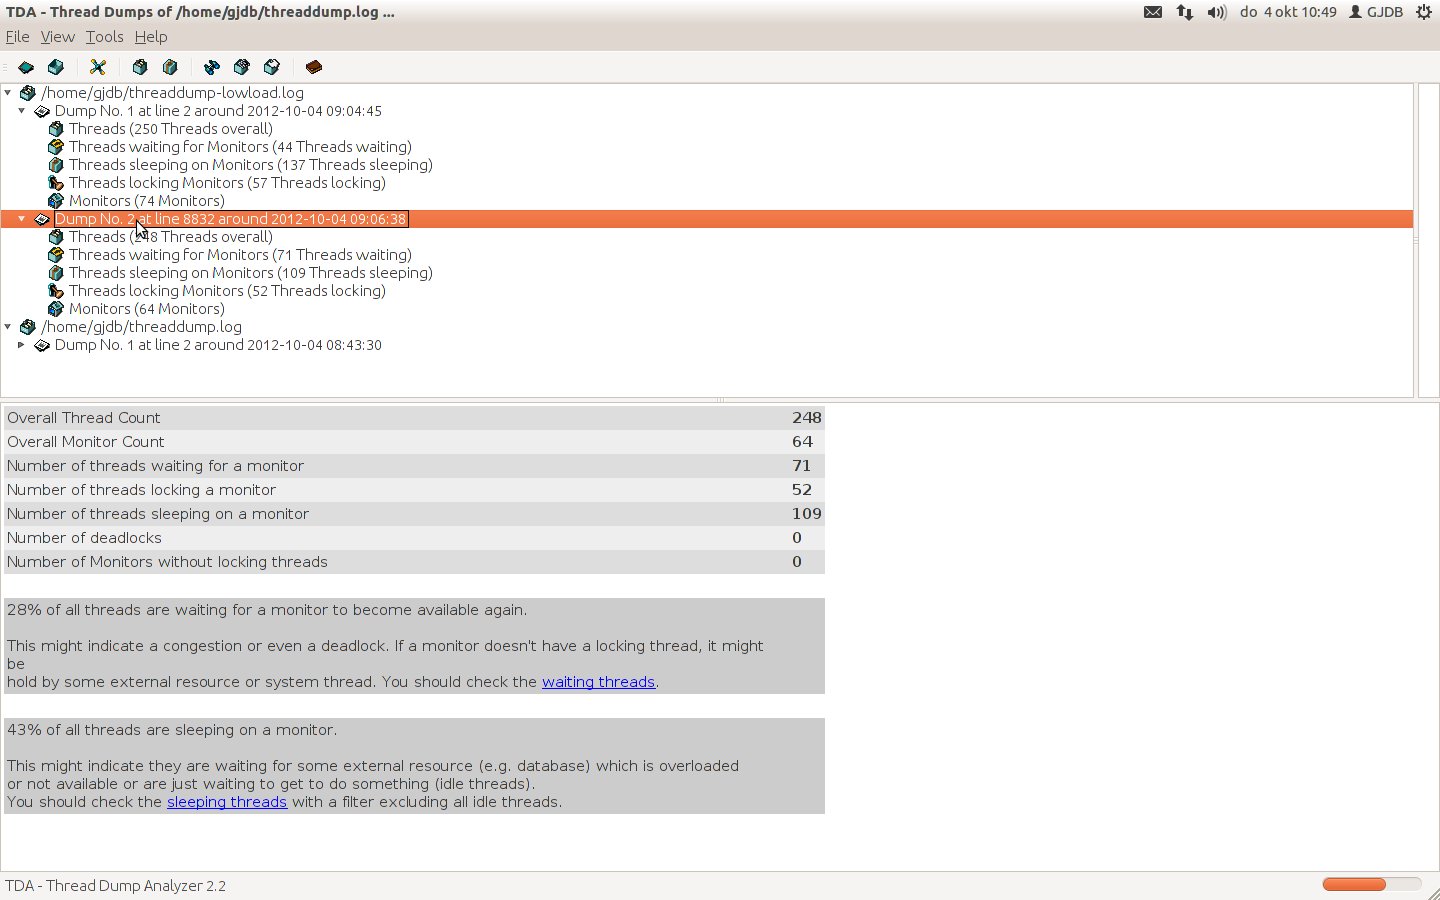
Of every Java proces a thread dump can be made (starting j2ee 1.4.2). To analyse a thread dump numerous tools are available. For example JCA by IBM developerWorks, or (what we will use) the TDA [Thread Dump Analyzer] which can be downloaded from here.
Linux
Perform the following command with jstack, which is in the same directory as jconsole:
jstack <pid> >> <location>/threaddump.log
Windows
Press CTRL+Break. The thread dump is printed in the command window, and you must cut / paste to a separate file in order to continue working on it.
After you have exported the threaddump, start the TDA program. This is commonly done with the following command:
java -jar tda.jar
In TDA, open the stored threaddump and start analyzing!

Sources
# http://www.nljug.org/pages/events/content/jfall_2006/sessions/00008/slides/
# http://java.sun.com/javase/technologies/hotspot/publications/TS-2690_doherty_24664_DSF.pdf
# Time waits : http://www.isi.edu/touch/pubs/infocomm99/infocomm99-web/
# http://www.theserverside.com/news/thread.tss?thread_id=50306
# http://blogs.warwick.ac.uk/kieranshaw/entry/ldap_connection_pooling/
# [http://pvalentino.blogspot.com/2007/10/generate-java-thread-dump-use-kill-3.html show all processes in Linux]
# [http://expertodev.wordpress.com/2009/05/30/how-to-take-java-thread-dump/ how to take a thread dump]

